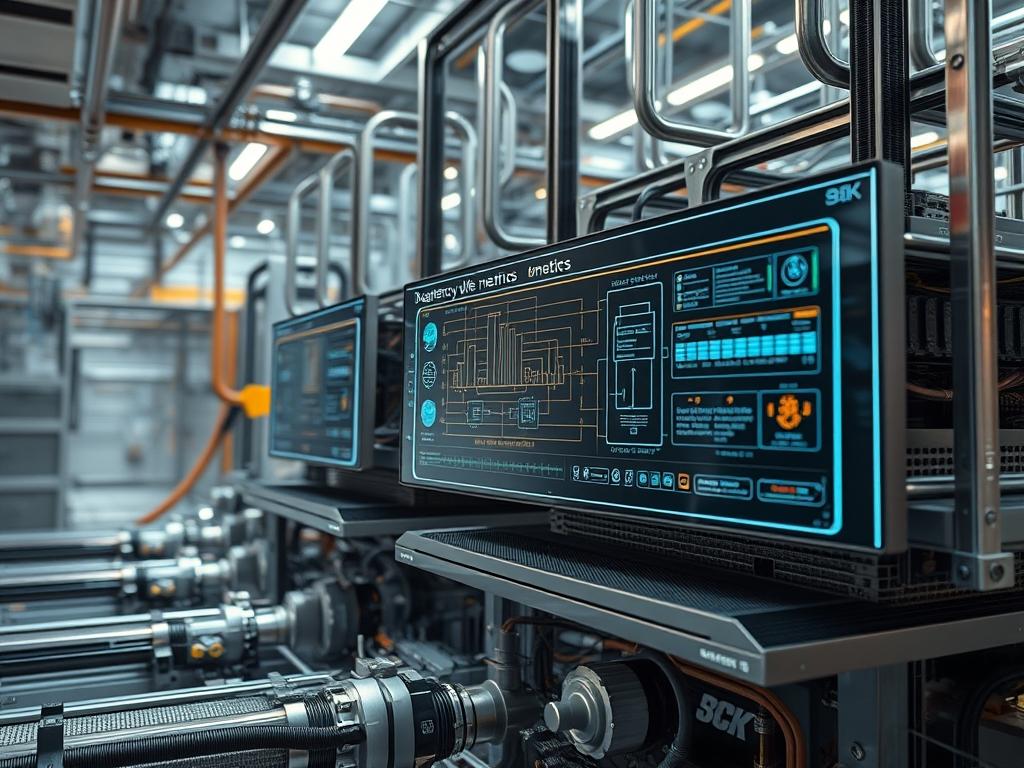
Battery cycle life metrics represent the primary telemetry for evaluating the longevity and operational solvency of stationary energy storage systems (ESS) within critical infrastructure. Whether deployed in a Tier IV data center or a distributed microgrid; these metrics quantify the degradation of electrochemical potential over time. Reliability in this domain is not merely a maintenance preference: it is a fundamental requirement for maintaining system uptime and protecting the underlying load. Monitoring capacity degradation data allows architects to predict the exact failure point of an asset before it reaches a state of critical insolvency. By integrating these metrics into a broader infrastructure stack; such as a Building Management System (BMS) or a Network Operations Center (NOC) dashboard; engineers can balance the discharge rate against the thermal envelope to maximize the return on investment. This manual outlines the protocols for capturing, analyzing, and optimizing these metrics to ensure that energy delivery remains constant despite the inherent chemical decay of the storage medium. The problem of unexpected power failure is solved through rigorous observation of electrochemical impedance and cycle counting.
Technical Specifications
| Requirement | Default Port/Operating Range | Protocol/Standard | Impact Level (1-10) | Recommended Resources |
| :— | :— | :— | :— | :— |
| Telemetry Polling | Port 502 (Modbus TCP) | IEEE 1188-2005 | 9 | 2 vCPU / 4GB RAM |
| Thermal Monitoring | -20C to +60C | 1-Wire / I2C | 8 | Thermal-grade sensors |
| Data Encapsulation | JSON over MQTT | ISO/IEC 20922 | 6 | High-bandwidth gateway |
| Voltage Precision | +/- 0.5% | NIST Traceable | 10 | 16-bit ADC |
| Cycle Analysis | 80% DoD Threshold | IEC 62619 | 7 | Localized logic controller |
The Configuration Protocol
Environment Prerequisites:
Successful implementation of the battery cycle life metrics suite requires a baseline infrastructure capable of high-resolution data ingestion. All hardware must comply with NEC Article 706 for energy storage systems. Software-side dependencies include a Linux-based environment (Ubuntu 22.04 LTS or RHEL 9) with Python 3.10+ and the InfluxDB-Client library. Network-layer access must be granted to the BMS-Gateway via TCP/502 for Modbus communication. Personnel must have SUDO-LEVEL permissions on the monitoring node and a calibrated FLUKE-MULTIMETER for manual verification of DC bus voltages.
Section A: Implementation Logic:
The engineering design focuses on the isolation of capacity degradation factors from transient environmental noise. We utilize a State of Health (SOH) algorithm that calculates the ratio of current discharge capacity to the original nameplate capacity. To achieve an idempotent data collection state; the system must log the Coulomb-Count during every full discharge cycle. The logic layer must account for thermal-inertia; which dictates that internal chemical reactions do not normalize immediately after a high-load event. By monitoring the dV/dt (rate of change in voltage) and dI/dt (rate of change in current); the system applies a weighting factor to the degradation curve; ensuring that a single “deep discharge” event does not skewed the long-term cycle life projection.
Step-By-Step Execution
1. Initialize Peripheral Sensor Interface
Establish a stable serial or Ethernet connection to the BCMS-7000-CONTROLLER. Ensure that the terminal interface is active by running systemctl status serial-getty@ttyUSB0.
System Note: This action initializes the physical layer driver in the Linux kernel; ensuring that the Universal Asynchronous Receiver-Transmitter (UART) buffer is cleared and ready for the incoming electrochemical payload.
2. Configure Modbus Register Mapping
Map the internal registers for State of Charge (SOC) and Temperature. Edit the configuration file at /etc/bms_monitor/register_map.conf to point REG_VOLT_BLOCK to address 40001.
System Note: Precise mapping prevents the misinterpretation of binary data. Incorrect addressing leads to signal-attenuation in the logic layer where 16-bit integers may be incorrectly truncated as 8-bit values.
3. Verify Signal Integrity and Calibration
Use the fluke-multimeter to measure the voltage across the MAIN-DC-BUS. Compare this physical readout to the value reported by the command bms_cli –read-voltage.
System Note: Calibration ensures that the software-level metrics reflect physical reality. Discrepancies here often indicate high latency in the ADC conversion or electrical noise interfering with the signal path.
4. Deploy the State of Health (SOH) Script
Execute the daemon responsible for tracking capacity degradation by running sudo python3 /usr/local/bin/soh_calc.py –start.
System Note: This script initiates a persistent process that monitors the charge-discharge-delta. It calculates the overhead of internal resistance; which is a pivotal metric for determining the end-of-life for lead-acid or lithium-ion cells.
5. Establish Logging and Time-Series Storage
Redirect the output of the cycle metrics to the time-series database using chmod +x /bin/data_ingest followed by executing the binary.
System Note: By utilizing a time-series database; the system can track throughput trends over years. This reduces packet-loss during peak monitoring periods as the database is optimized for high-concurrency write operations.
Section B: Dependency Fault-Lines:
The primary failure point in battery metric systems is the divergence between nominal capacity and actual energy delivery. If the BMS-GATEWAY firmware is out of sync with the SENSOR-NODES; data corruption will occur. Another bottleneck is the thermal-inertia of the battery room itself. If sensors are placed too far from the terminals; the reported temperature will lag behind the internal cell temperature; leading to inaccurate SOH calculations. Software-side conflicts often arise from Python library mismatches; specifically between pymodbus versions which may change the way encapsulation is handled for different hardware manufacturers.
The Troubleshooting Matrix
Section C: Logs & Debugging:
When a metric fails to report; practitioners must first inspect the system logs located at /var/log/battery_mgmt.log. Look for specific error strings such as ERR_BMS_TIMEOUT or E042_LOW_SIGNAL. If the log shows high packet-loss; check the physical cabling for electromagnetic interference. Use the command tail -f /var/log/syslog | grep rs485 to see if the kernel is dropping frames from the serial interface. If the SOH values show a sudden drop to zero; verify the integrity of the SHUNT-RESISTOR connection. A disconnected shunt will result in zero current flow detection; which the algorithm interprets as a dead string. Visual cues on the LED-STATUS-PANEL of the controller; such as a blinking amber “COMM” light; indicate that the latency of the polling loop is too high; forcing the watchdog timer to reset the connection.
Optimization & Hardening
– Performance Tuning:
To maximize throughput of the telemetry data; adjust the polling interval from 1000ms to 250ms for critical nodes. This increases the resolution of the discharge curve; allowing for better capture of peak demand transients. Implement concurrency in the data processing layer by using a multi-threaded listener that handles independent battery strings on separate CPU cores. This prevents a slow-responding string from creating a bottleneck for the entire array.
– Security Hardening:
The BMS should be isolated on a dedicated VLAN. Use iptables -A INPUT -p tcp –dport 502 -s 192.168.1.50 -j ACCEPT to restrict Modbus access to the known monitoring server only. Disable all unused services on the gateway; such as Telnet or unencrypted HTTP. All data transmitted to the cloud or remote NOC should reside within an encrypted VPN-TUNNEL to prevent the interception of critical infrastructure health data.
– Scaling Logic:
As the infrastructure grows from a single rack to a multi-MW facility; the monitoring architecture must scale horizontally. Deploy additional EDGE-COLLECTORS that aggregate data locally before pushing a compressed payload to the central repository. This reduced the overhead on the primary network trunk and ensures that local fail-safe logic can operate even if the secondary network link experiences a total outage.
The Admin Desk
FAQ 1: How do I reset the cycle count after a battery replacement?
Execute the command bms_cli –reset-cycle-count –string-id 04. This is an idempotent action that updates the non-volatile memory in the BCMS-CONTROLLER to reflect the installation of new electrochemical cells.
FAQ 2: Why is the State of Health (SOH) calculation inconsistent?
This usually occurs when the discharge depth is insufficient for the algorithm to recalibrate. Perform a full discharge to at least 20% SOC to allow the system to measure the actual capacity against the theoretical maximum.
FAQ 3: What causes high latency in the monitoring dashboard?
High latency is often caused by a bottleneck in the MQTT-BROKER or an over-saturated serial line. Check for signal-attenuation on long cable runs and ensure the database isn’t locked by a heavy query.
FAQ 4: Can I monitor multiple chemistries on one gateway?
Yes; however; you must define unique profiles in /etc/bms_monitor/chem_profiles.conf. Each chemistry requires specific coefficients for calculating degradation to account for different thermal-inertia and discharge characteristics.
FAQ 5: How does packet-loss affect the degradation data?
Intermittent packet-loss leads to gaps in the time-series data; which causes the integration algorithm to underestimate the total energy throughput. This results in an artificially inflated SOH reading; masking the true age of the battery.